For years at Envisioning we have catalogued emerging technologies one entry at a time, across research hubs on defence, biotechnology, energy, space, textiles and dozens more. The Technology Graph is what happens when you stop reading that catalogue as a list and look at it as a shape.
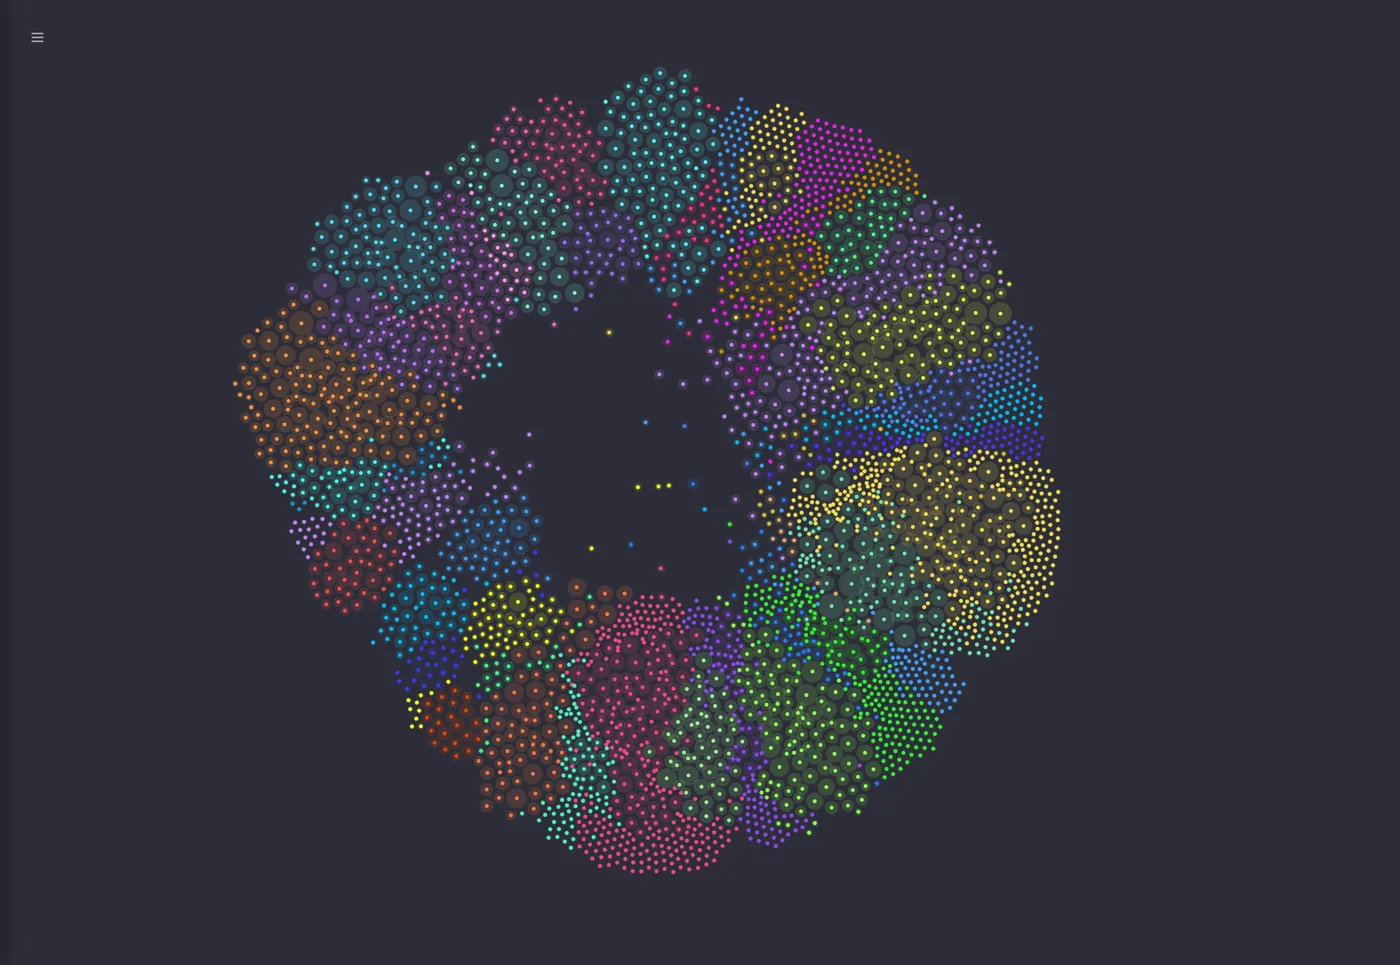
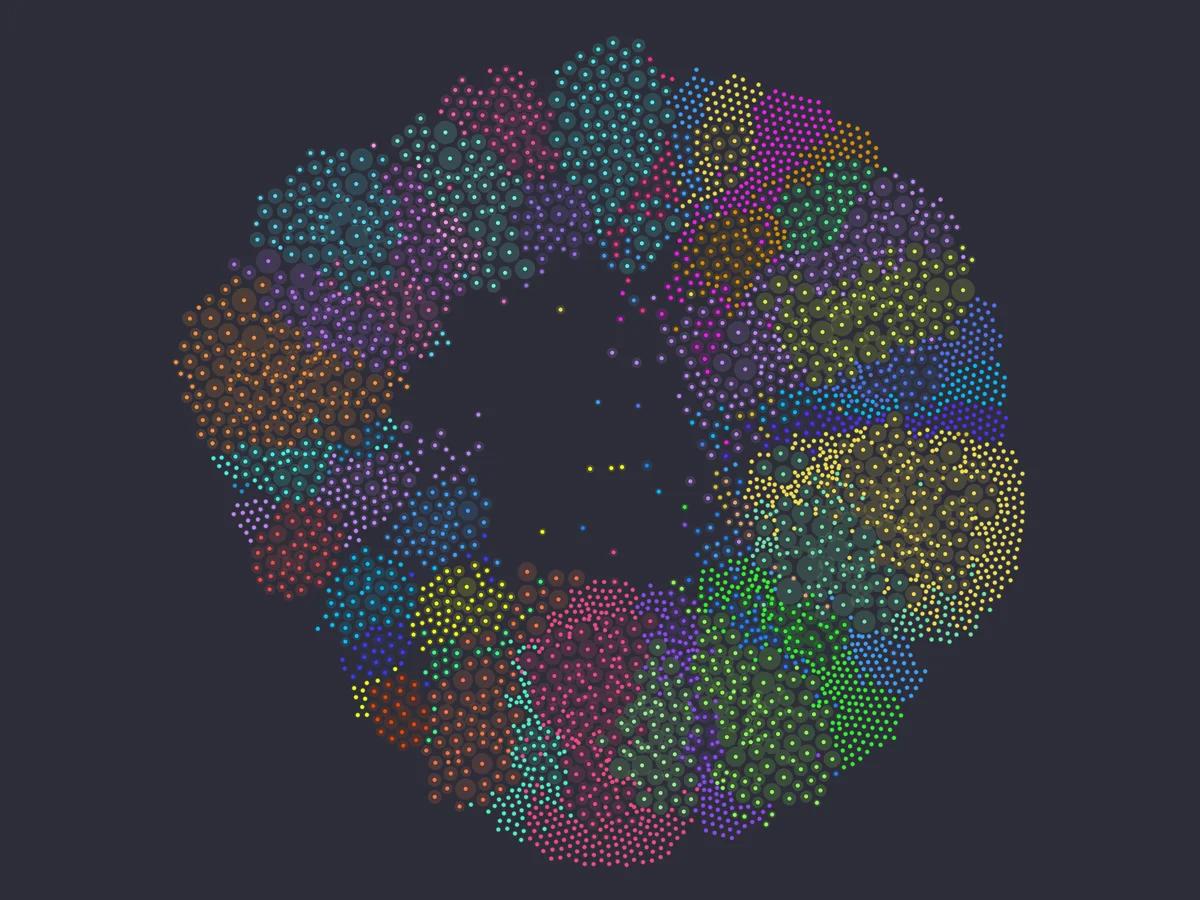
Every dot is a technology, and its colour is the research hub it comes from. There are 3,650 of them in 45 hubs. The largest are Aegis (defence and security, 376 technologies), Helix (biotechnology, 331) and Grid (energy and utilities, 204).
The lines come from meaning, not from tags. Each technology's description is turned into an embedding, a list of numbers that places similar ideas close together. Two technologies in the same hub are linked when they are clearly related. Two in different hubs need a much higher similarity before they are linked, so only the strongest bridges survive. That gives 5,539 links, of which 673 cross between hubs. A force-directed layout then pulls linked technologies together and pushes the rest apart.
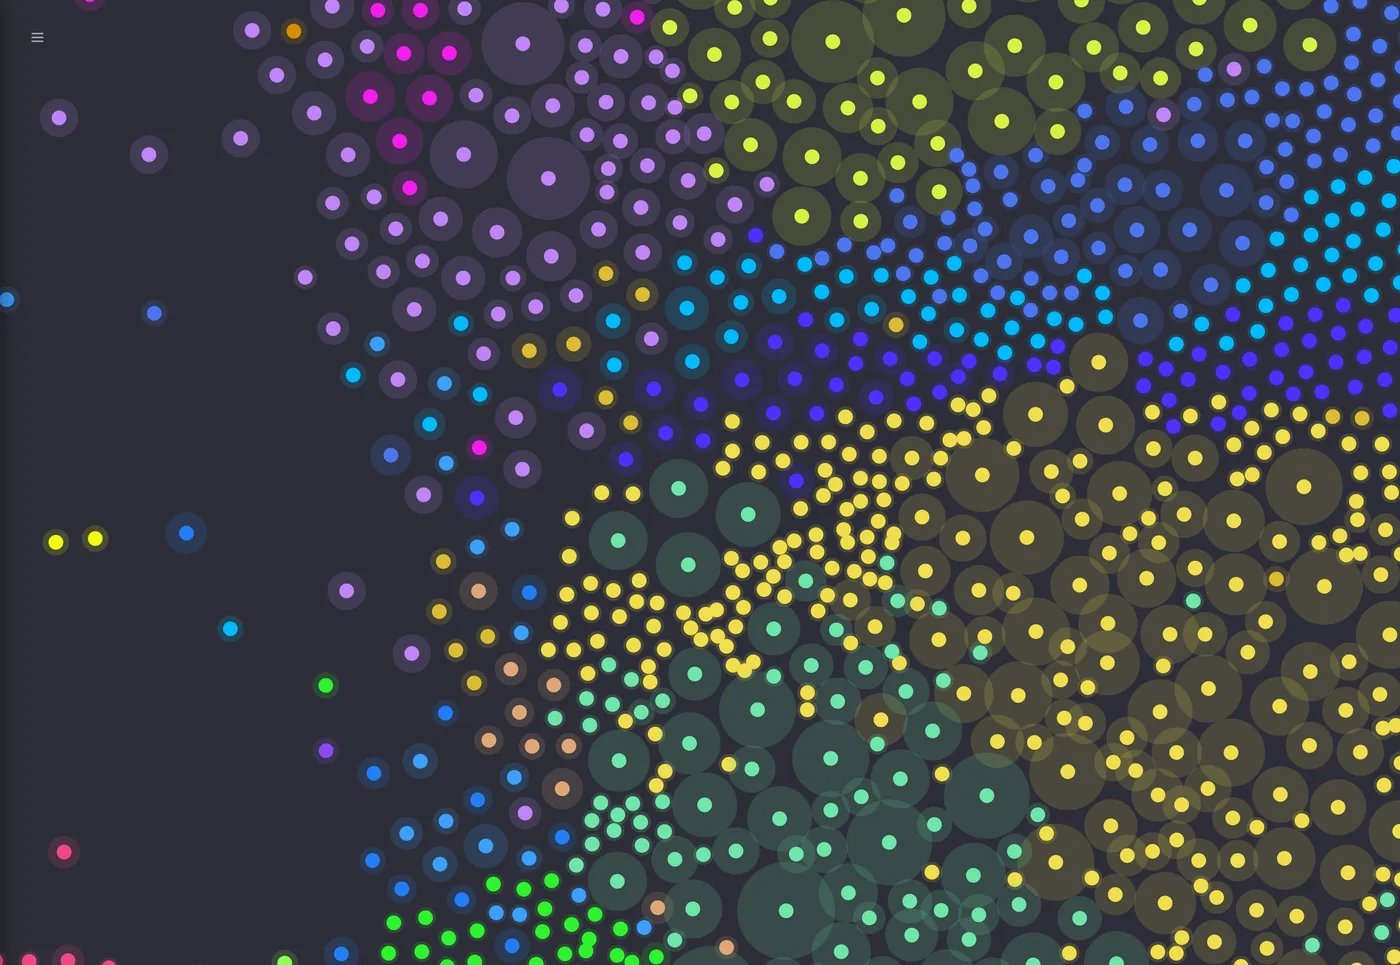
The interesting parts are the edges between clusters. The same idea often turns up in several hubs, each time seen from a different industry. In-situ resource utilisation, making materials from what you find where you are, appears in the space, extractives, critical infrastructure and civilisational resilience hubs. The Physical Internet shows up in manufacturing, mobility and logistics. Quantum optimisation ties the quantum hub to supply chains, and closed-loop life support ties space to resilience. These bridges are where one industry's research could answer another industry's problem, and where our foresight work often starts.
The same embeddings also catch near-duplicates. 185 pairs are so close that they probably describe the same technology under two names, which tells us where the catalogue needs cleaning.
Explore it at envisioning.com/research/graph. Zoom in, click a dot, and follow the bridges.